Gender pay gap report 2022
Key points
- The mean gender pay gap has decreased from 20.2% in 2021 to 17.6% in 2022.
- The median gender pay gap has decreased from 18.1% in 2021 to 14.9% in 2022.
- The mean gender pay gap for those staff on the University grade scale is below 2.5% for each individual grade, except for Grade 3 (3.5%) and Grade 9 (12.2%).
- The main drivers of gender pay gap are the distribution of staff (with women forming a majority of staff at the lower paid grades and minority of staff at the higher paid grades) and the difference in pay at Grade 9.
Introduction
Equality, diversity, and inclusion is a core pillar in the University Strategy. The University is committed to promoting inclusivity and providing equal opportunity for all of its staff and students.
The University was first awarded an institutional Athena Swan Bronze Award in 2013, renewed in 2018, which recognised our commitments and achievement in addressing gender equality issues. All our academic schools hold a school level Athena Swan Award including Gold, Silver, and Bronze.
This is our sixth report on the gender pay gap. We continue to monitor our gender pay gaps, work to understand reasons for pay differentials, and strengthen our actions to address gender imbalance in recruitment and promotion in order to reduce the gender pay gap.
We adopt a framework provided by the UK Government in calculating gender pay gap. The gender pay gap is a measure of the difference between the average hourly pay of men and women across the whole organisation. It is not a measure of unequal pay, which is the difference in pay between men and women doing the same job. Unequal pay is against the law, as set out in the Equality Act 2010.
The analysis is based on our payroll data as at 31 March 2022. This report focuses on the gender pay gap. Further reports and analysis will be conducted to assess the ethnicity pay gap and disability pay gap among the 2022 population. The reports will be published in due course.
Key findings on gender pay gap
The population
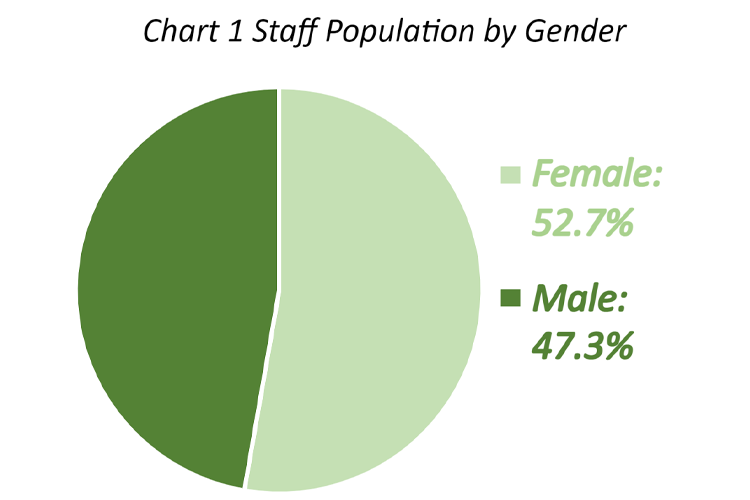
As at 31 March 2022, there were 3830 staff members who were on the University payroll and who met the UK Government’s definition for inclusion in the gender pay gap population. This population includes staff on Permanent, Fixed- Term, or Flexible contracts, on either Full-Time or Part-Time contracts of employment. Of the total 3830 staff members, 52.7% (2020) were female and 47.3% (1810) male (Chart 1).
Overall gender pay gap 2022
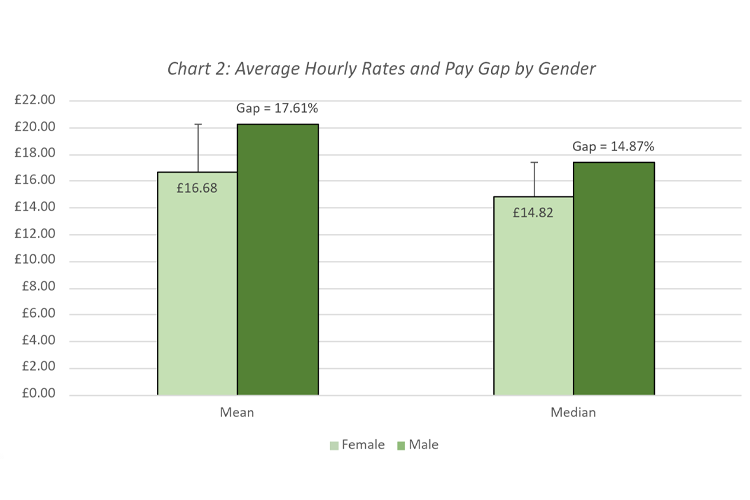
The gender pay gap is the percentage difference between the average hourly rate for male staff and female staff.
Chart 2 shows the mean (average) hourly rate for female staff is £16.68 compared with £20.25 for male staff. This indicates that female staff are paid 17.6 % less than male staff.
The median hourly rate for female staff is £14.82 compared with £17.41 for male staff. This means when the hourly rate for individual female staff members are arranged in order, the middle point hourly rate for female staff (£14.82) is 14.9% lower than that for male staff (£17.41).
Trends in gender pay gap
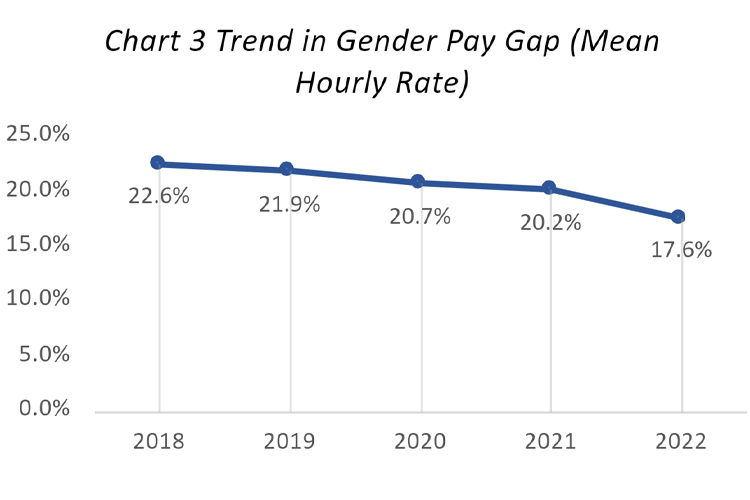
The overall mean gender pay gap has been declining since 2018 (Chart 3). It has fallen by 5.0 percentage points between 2018 and 2022 and 2.6 percentage points, compared with 2021.
Compared with 2021, the mean gender pay gaps have decreased among staff at Grade 5, 6, 8 and for those on flexible contracts. These groups of staff together account for 67% of 2022 gender pay gap population. The change amongst these groups have collectively contributed to the decrease in the overall mean gender pay gap in 2022.
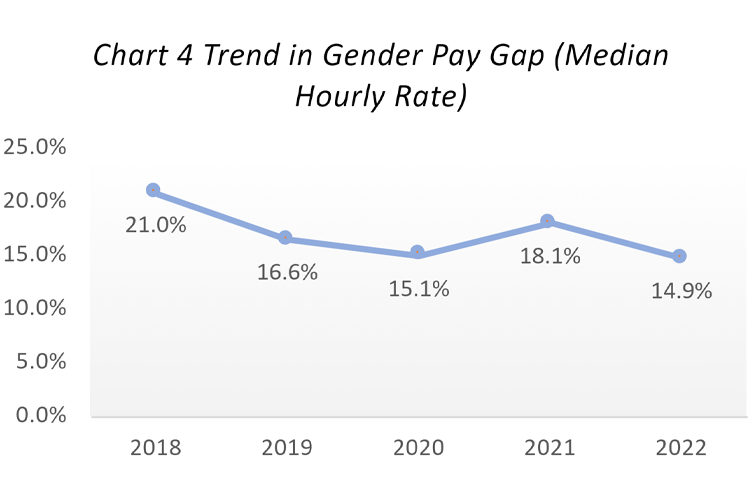
The median gender pay gap has been fluctuating over the last five years (Chart 4). After an increase in the last year (mainly due to the Covid-19 pandemic resulting in a significant drop in the number and proportion of male staff on flexible contracts), 2022 saw the median gender pay gap fall to 14.9%, the lowest since the pay gap analysis began in 2017.
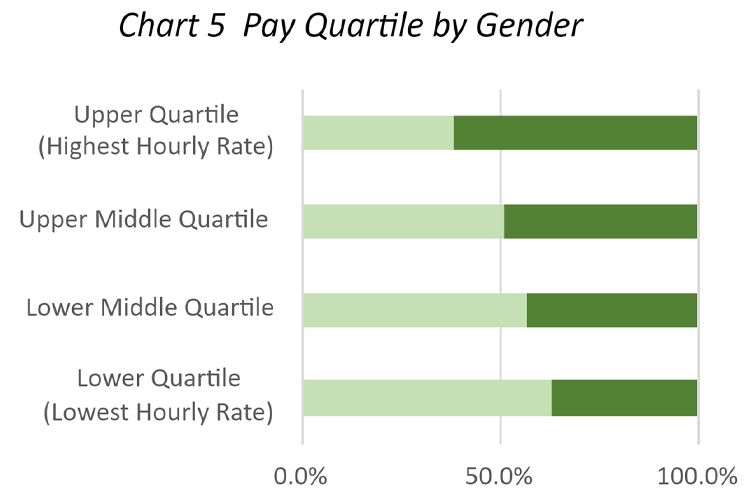
Gender pay quartile
Chart 5 shows that 38.8% of staff in the Upper Quartile (highest hourly rate group) are female and 61.2% are male staff. In contrast, amongst staff whose pay is in the Lower Quartile (lowest hourly rate group), 63.6% are female. This distribution of staff with men forming the majority of higher paid staff and women the majority of lower paid staff is the main reason the average hourly rate for female staff is lower than that for male staff.
Gender pay gap UK benchmarks
Based on the ONS report the Annual Survey of Hours and Earnings (2022 Provisional), the mean gender pay gap for all employees in the UK is 13.9% and the median gender pay gap is 14.9%.
Advance HE’s Staff Statistical Report (2022) reported that in UK higher education in 2020/21, the mean gender pay gap was 14.8% and the median pay gap was 8.5%. In Scottish HE the mean gender pay gap was 15.2% and the median pay gap was 16.2%.
It should be noted that our gender pay gap figures may not be directly comparable to the UK gender pay gap benchmarks due to the differences in the methodology and the data sources used.
The gender pay gap in Advance HE’s Staff Statistical Report (2022) is based on the contract salary for members of staff at each institution at 31 July in the reporting period, or the end date of the contract if earlier. Members of staff for whom the concept of a per annum contractual salary does not apply (e.g. staff paid hourly, staff with zero-hour contracts etc) have been excluded from the salary analysis.
Gender pay gap by grade
Most staff on the University are employed on a 9- point grade scale, details of which can be found on the University’s website. When the mean gender pay gap is broken down by grade (Appendix), the analysis shows that the mean gender pay gaps for Grades 1 to 8 are 3.5% or less. The median gender pay gaps for Grades 1 to 8 are also low, 2.9% or less.
However, the mean and median gender pay gaps for Grade 9 are 12.2% and 12.4% respectively. When the Grade 9 group is excluded from the population, the overall institutional mean gender pay gap falls to 10.6%, suggesting the Grade 9 group has the largest impact on the overall mean gender pay gap.
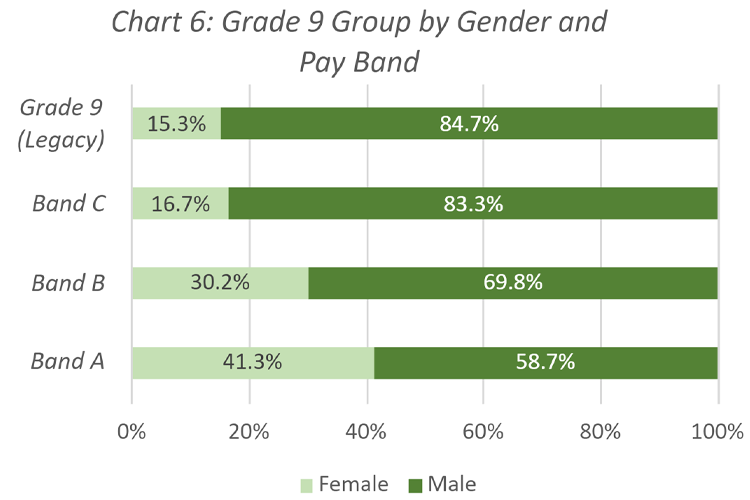
Chart 6 shows that 83.3% of staff in the Grade 9 top pay band (Band C; see Table 1 for hourly rate) are male and only 16.7% are female. In contrast, in the lower pay band (Band A) 41.3% are female, compared with 58.7% male. This, coupled with the higher proportion of male staff on the higher paying legacy Grade 9 band (see note 1), is likely to be main reason the mean and median gender pay gaps are high amongst the Grade 9 group.
| Grade 9 Band | Female | Male | Pay Gap |
|---|---|---|---|
| Grade 9 (Legacy) | £40.27 | £44.87 | 10.3% |
| Band A | £33.60 | £34.17 | 1.7% |
| Band B | £40.18 | £43.41 | 7.4% |
| Band C | £54.64 | £56.01 | 2.4% |
| Grade 9 Overall | £37.44 | £42.64 | 12.2% |
Note 1: In 2017 the University introduced a sub-grade pay banding structure within Grade 9 (i.e., 9A, 9B, and 9C), whilst some staff remain on legacy Grade 9 contracts.
Gender pay gap for flexible contracts
Our staff on flexible contracts are not on the University grade scale. This group of staff account for 19.6% (751 headcount) of the gender pay gap population and are amongst the low paid of all our staff.
The mean and median gender pay gaps for staff on flexible contracts are 7.8% and 15.9% respectively.
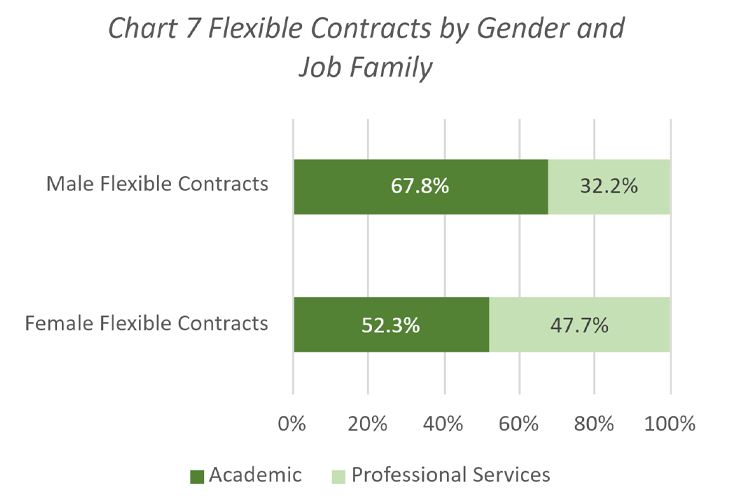
Chart 7 shows that 67.8% of male staff on flexible contracts are academic staff, compared with 52.3% of female staff on flexible contracts. Given the higher hourly pay for academic flexible contracts, this gender imbalance has resulted in the overall mean gender pay gap for flexible contracts.
When the mean gender pay gap for the flexible contracts is further broken down by job family, it is revealed that the mean gender pay gap for academic flexible contracts is just 2.0% and 6.3% for professional services flexible contracts (Table 2). This suggests that the gender pay gap is mainly among professional services flexible contracts and they are the main contributor to the overall mean gender pay gap for flexible contracts.
| Job family | Female | Male | Pay gap |
|---|---|---|---|
| Academic | £14.33 | £14.62 | 2.0% |
| Professional services | £10.25 | £10.94 | 6.3% |
| Flexible contracts overall | £12.39 | £13.44 | 7.8% |
Table 3 demonstrates the overall median gender pay gap for flexible contracts is 15.9%, however, when the median is broken by job family, the median pay gap for academic flexible contracts and the median for professional services flexible contracts are all 0%. The overall median gender pay gap (15.9%) is likely to be due to the higher proportion of academic staff (67.8%) within male flexible contracts and the higher hourly pay for academic flexible contracts.
| Job family | Female | Male | Pay gap |
|---|---|---|---|
| Academic | £14.82 | £14.82 | 0% |
| Professional services | £9.90 | £9.90 | 0% |
| Flexible contracts overall | £12.46 | £14.82 | 15.9% |
Gender pay gap for other groups
Gender pay gap for Apprentice, Off-scale (various roles are included in this category) and NHS (staff on NHS pay scale) are not covered in this report. These groups of staff are not on the University grade scale. Total number of staff members in each of these groups are small. When figures for each of these groups are broken down for analysis, some numbers are too small for publishing. However, the further analysis on gender pay gap for these groups will be carried out. The results will be discussed internally.
Bonus payments
The University currently has no contractual bonus arrangements.